Monitoring Realtime Linux Performance Metrics Using Netdata
23 Jun 2016I have a huge passion for monitoring, and performance monitoring among all types is the most fascinating one. Just recently a really nice tool named Netdata has been released for the Linux platform. A very well thought piece of software that works out of the box on almost any Linux distribution and covers almost all the system metrics that you can think of. It goes into great details as compared to the traditional monitoring tools and gives a very nice and slick web interface using bootstrap dashboards running on node.js.
Here is a quick preview of the tool. Just the web interface makes you fall in love with it:
It is true real-time. Extremely useful for debugging live systems and digging down on bottle necks. It can also be used to monitor the system during the stress/load/performance testing.
Here are some of the key features of this tool that I love:
Stand-alone and light-weight tool with minimum dependencies.
It comes with an automatic installer that automatically builds the software on the system. You will need the development tools and libraries which we will cover during the installation. By default it runs as a non-privileged user “netdata” which is created and setup by the installer for you. It is written in C making it really efficient and light-weight, just expects 2% of a single core CPU usage and a few MB of RAM.
Supported on all Linux distributions.
The cool thing about this tool is that it hooks with the kernel directly which makes it distribution agnostic and it runs anywhere a Linux kernel runs. Just imagine the possibilities!
Runs out of the box
Trust me a 5 year old can deploy this! Seriously, its dead simple to deploy. The web server is built-in so you won’t need to setup the web server separately, although you can integrate it to a web server like apache or nginx if you want to do some thing fancy. It comes with sane default configurations and you can modify the default configuration to tweak it to your desire. It will run with zero configuration, literally! You can touch an empty netdata.conf file and it will use the defaults (God, I love this thinking).
Very detailed monitoring
It really goes into great details of the system. You will be amazed, at least I was. With the default zero configuration, it will monitor over 2000 metrics and give you more than a 100 charts. Aside from the standard stuff like CPU, RAM, DISK IO and NETWORK IO, it goes into the depth of applications, processes and users which lets you visualize the resource usage by each process/application or user. That is truly remarkable, I can’t think of any tool that does that.
It doesn’t end there, it comes with a variety of plugins that will auto detect services like MySQL, Apache, Nginx, Tomcat, PHP-FPM etc. and lets you monitor the application specific metrics.
NOT a Health Monitoring tool
Before we go on to installing it on our systems, it is worth mentioning that it is not a health monitoring tool like nagios, icinga, zabbix etc. It is a Real time performance monitoring tool. It will not send you notifications or send data to a centralized server or keep a long term history of the metrics. This is the key difference between health monitoring and performance monitoring.
By default netdata will keep history of 3600 seconds (1 hour) which can be modified according to your requirements. Each netdata installation is stand-alone with no communication with any another netdata installed system. You open the all the netdata web interfaces from you browser and additionally you can create custom dashboards by embedding charts from multiple netdata installations together.
Netdata Installation
As I mentioned earlier, installation is dead simple. All you have to do is, install the development tools and run the automatic installer.
Install the development tools
For Debina/Ubuntu based distributions:
apt-get install zlib1g-dev uuid-dev libmnl-dev gcc make git autoconf autogen automake pkg-config curl jq nodejs
For Redhat/Fedora based distributions:
yum install zlib-devel libuuid-devel libmnl-devel gcc make git autoconf autogen automake pkgconfig curl jq nodejs
Get and Build Netdata
Lets get the latest release from github:
cd /opt/
git clone https://github.com/firehol/netdata.git
And run the automated installer:
cd /opt/netdata
./netdata-installer.sh
Once you run the installer, it will show you the installation paths and ask you to confirm by pressing ENTER:
[root@kxrdesk netdata]# ./netdata-installer.sh

Welcome to netdata!
Nice to see you are giving it a try!

You are about to build and install netdata to your system.

It will be installed at these locations:

  - the daemon    at /usr/sbin/netdata
  - config files  at /etc/netdata
  - web files     at /usr/share/netdata
  - plugins       at /usr/libexec/netdata
  - cache files   at /var/cache/netdata
  - db files      at /var/lib/netdata
  - log files     at /var/log/netdata
  - pid file      at /var/run

This installer allows you to change the installation path.
Press Control-C and run the same command with --help for help.

Press ENTER to build and install netdata to your system >
It will then configure the development environment and build an install the software for you. Once the installation is complete, it will show you the summary:
-------------------------------------------------------------------------------

OK. NetData is installed and it is running (listening to *:19999).

-------------------------------------------------------------------------------

INFO: Command line options changed. -pidfile, -nd and -ch are deprecated.
If you use custom startup scripts, please run netdata -h to see the
corresponding options and update your scripts.

Hit http://localhost:19999/ from your browser.

To stop netdata, just kill it, with:

  killall netdata

To start it, just run it:

  /usr/sbin/netdata


Enjoy!

Uninstall script generated: ./netdata-uninstaller.sh
That is it! Netdata has been installed and configured on your system. By default it listens on all interfaces on port 19999. If you are installing it on your local Linux desktop, just browse:
http://localhost:19999/
If you installed it on a remote host, make sure the firewall on that host and any firewall in between allows you to connect to the netdata port; And open it by the IP Address or hostname from your browser.
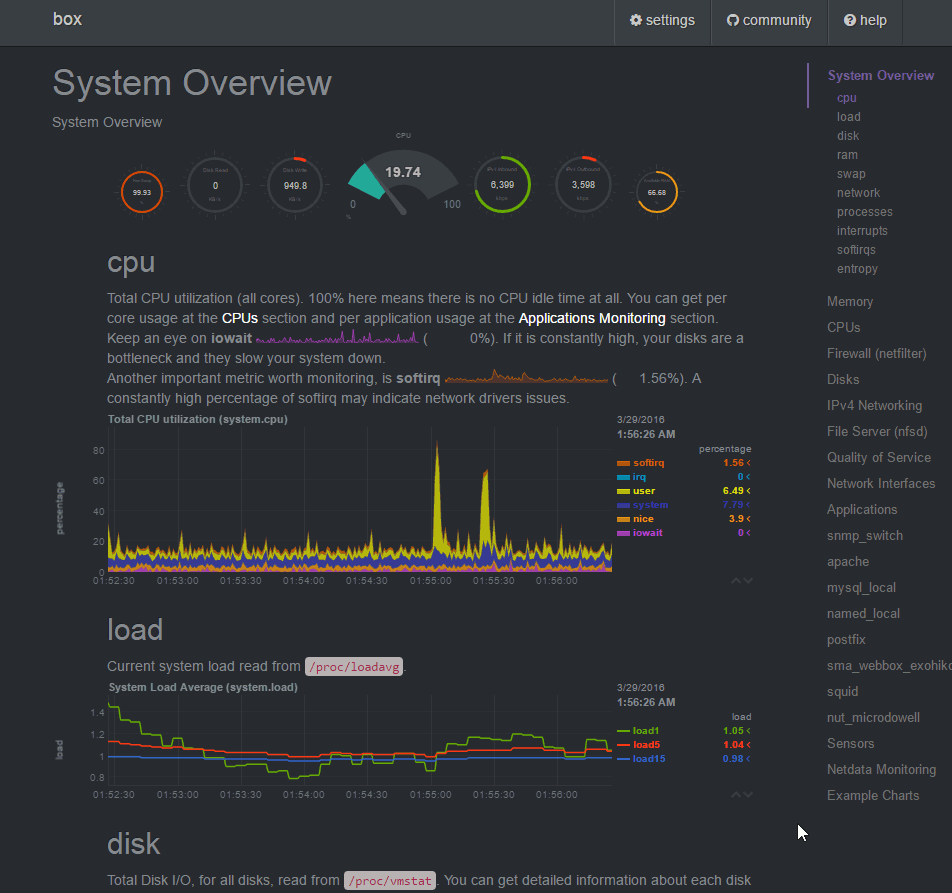
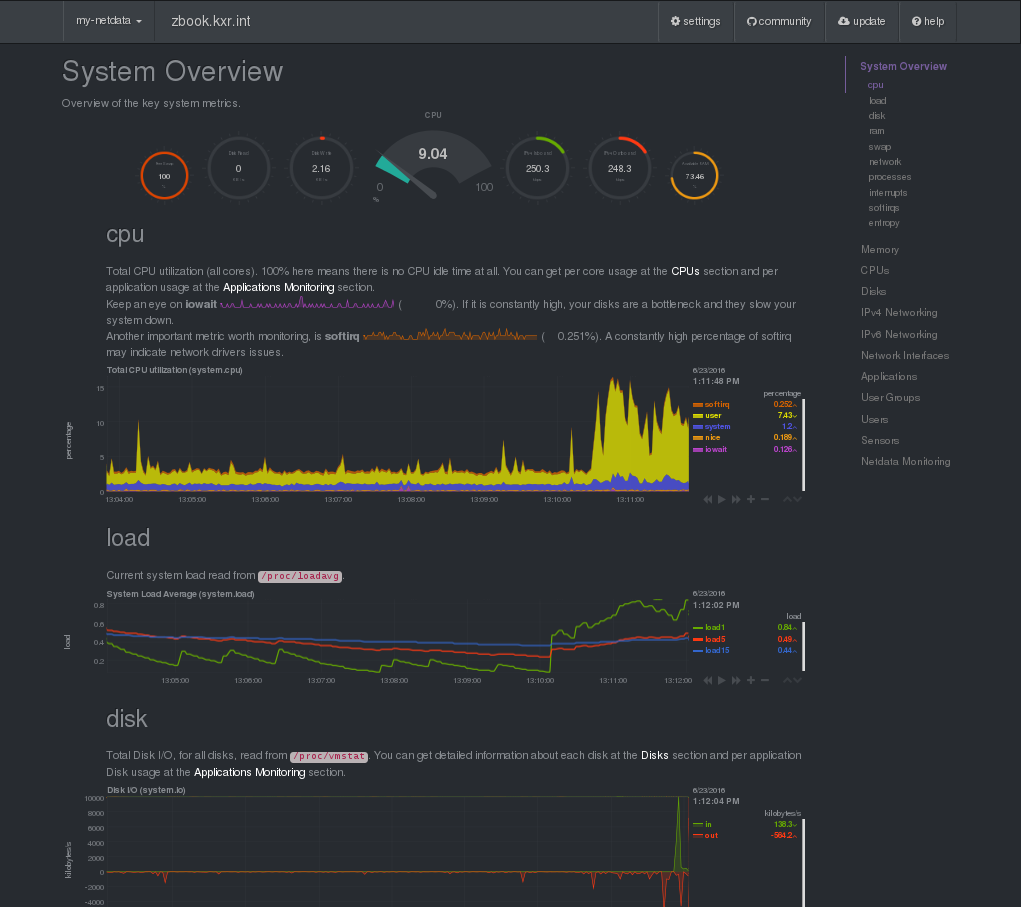
Here is a screen shot of netdata, freshly installed on my Fedora 23 laptop, with the default configuration:
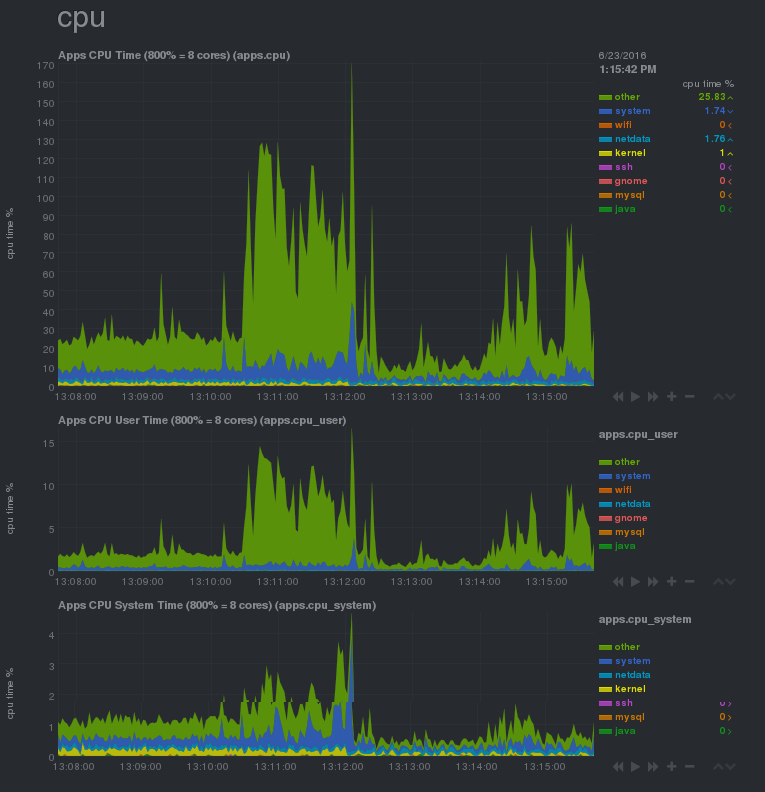
Here is the CPU utilization grouped by applications: